Resource Allocation Models Driven by Team Entry Data in Overlapping Athletic Competitions
Devon Schwarz · Jul 8, 2026

Resource Allocation Models Driven by Team Entry Data in Overlapping Athletic Competitions
Resource allocation models in overlapping athletic competitions rely on team entry data to determine how facilities, time slots, and support services get distributed among concurrent events, and researchers have tracked these systems across regional and national levels since the early 2010s. Organizers collect registration details including team sizes, preferred availability windows, and historical participation rates, then feed that information into scheduling algorithms that balance demand against fixed venue capacities. In multi-league environments where basketball tournaments, soccer leagues, and volleyball circuits share the same indoor complexes, entry data becomes the primary input for predicting peak usage periods and preventing double-bookings.
Core Components of Entry-Data Models
Models begin with structured intake forms that capture roster counts, age divisions, and travel distances, after which statistical packages process the numbers to generate priority scores for each entrant. Linear programming techniques assign court hours or field blocks based on those scores, while machine learning layers incorporate past no-show rates and late-registration patterns to refine forecasts. Observers note that when two leagues overlap on a single weekend, the system flags potential conflicts early because entry databases update in real time and trigger automatic reallocation rules. Data from the Australian Sports Commission shows that facilities using such integrated models reduced idle court time by measurable percentages during high-density summer schedules.
Handling July 2026 Overlaps
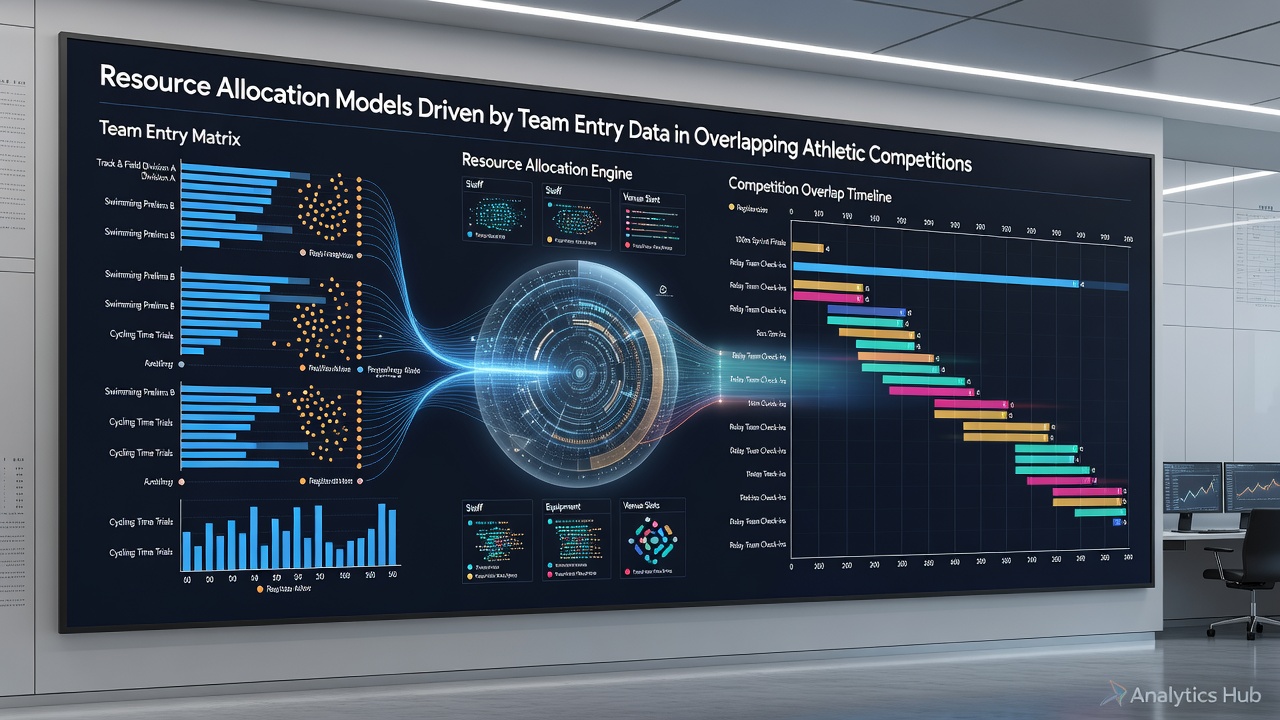
July 2026 presents a particularly dense calendar for North American and European circuits, with youth basketball nationals, adult soccer festivals, and masters volleyball championships all converging on shared municipal venues. Entry data collected through May and June feeds predictive engines that project daily attendance curves and adjust lighting, security, and equipment distribution accordingly. One documented case in a mid-sized Canadian city demonstrated how a sudden influx of 47 additional teams registered within a 72-hour window prompted the model to shift three lower-priority divisions to satellite sites, freeing central courts for the largest divisions without extending overall event duration.
Integration with Venue and Staffing Systems
Modern implementations link entry databases directly to facility management software so that lighting schedules, parking allocations, and volunteer rosters adjust automatically once registration thresholds are crossed. When a model detects that combined entries from two overlapping tournaments will exceed 120 teams on a given day, it activates overflow protocols that include additional referees and extended medical coverage. Industry reports from the National Collegiate Athletic Association indicate that institutions running these linked systems experience fewer last-minute cancellations because organizers receive alerts the moment entry volumes approach venue limits. Those alerts allow staff to open alternate fields or negotiate shared-use agreements with nearby schools before conflicts materialize.
Performance Metrics and Adjustment Loops
After each competition cycle, post-event analytics compare projected versus actual attendance derived from entry data, then recalibrate the weighting factors used in future allocations. Metrics tracked include average wait times for equipment handoff, percentage of teams receiving their first-choice time slots, and total travel distance across all participants. Researchers at the University of Queensland have published findings showing that iterative model updates based on these loops improve allocation efficiency by double-digit margins over successive seasons in multi-sport hubs. The feedback mechanism also accounts for external variables such as weather-related venue closures, allowing the system to redistribute remaining slots according to original entry priorities rather than first-come, first-served logic.
Conclusion
Resource allocation models driven by team entry data continue to evolve as overlapping athletic competitions grow in number and complexity, and the integration of real-time registration feeds with venue operations produces measurable improvements in utilization and participant experience across multiple regions. As July 2026 approaches, organizers who maintain clean, updated entry datasets position their facilities to handle simultaneous demands without manual intervention, while ongoing performance reviews ensure the underlying algorithms remain responsive to shifting participation patterns.