Performance Metrics Guiding Facility Prioritization in Recreational Sports Networks
Devon Schwarz · Aug 2, 2026
Performance Metrics Guiding Facility Prioritization in Recreational Sports Networks
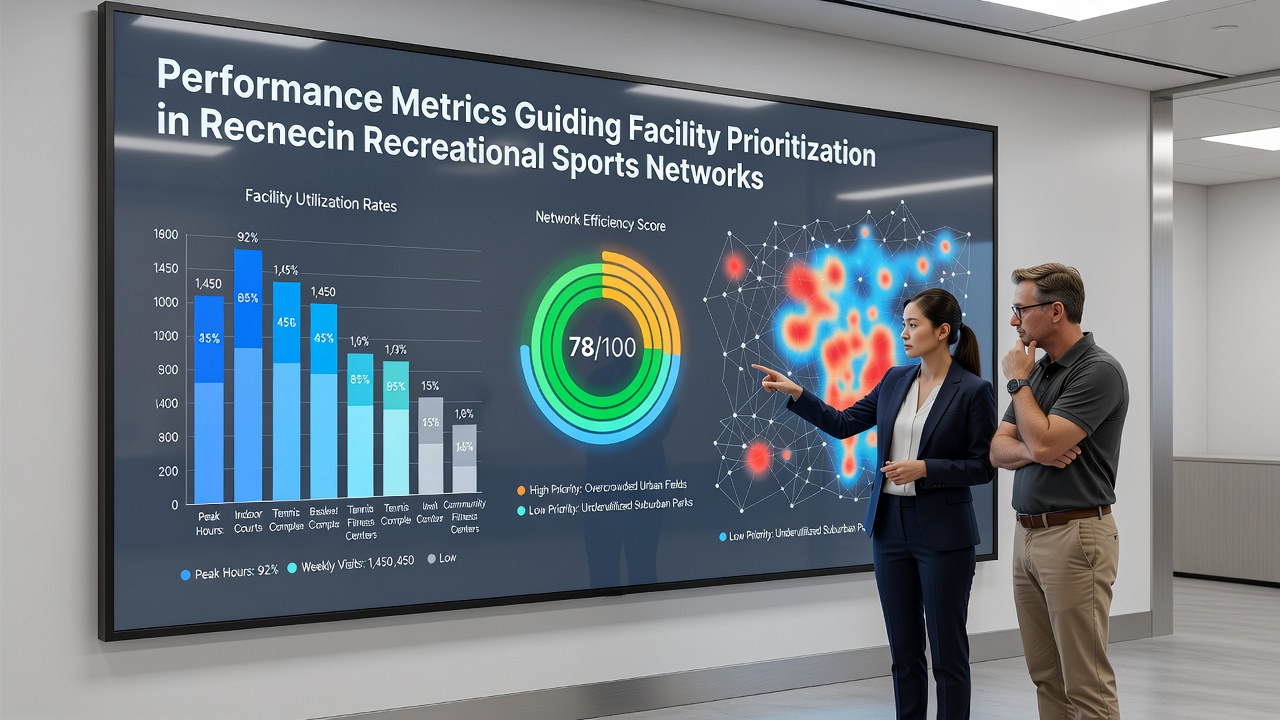
Recreational sports networks track usage statistics, revenue generation, maintenance costs, and participation trends to determine which venues receive upgrades or expanded access, while networks in multiple regions apply these indicators to allocate limited resources across shared facilities. Data from municipal and league-operated sites shows that facilities with higher daily throughput and consistent event hosting often move to the front of maintenance queues, whereas underutilized sites receive deferred attention until metrics improve. Observers note that this approach emerged more clearly after 2024 when several North American and European networks digitized their booking systems and began feeding real-time numbers into central dashboards.
Core Metrics That Shape Decisions
Networks collect hourly occupancy rates, average session length, and repeat-user percentages alongside direct revenue from court fees and equipment rentals. Researchers at the University of Waterloo documented how facilities posting occupancy above 75 percent during peak evening hours secured priority resurfacing contracts in the 2025 season, while those below 40 percent saw scheduling adjustments instead. Additional indicators include injury incident logs, equipment downtime records, and user feedback scores gathered through post-booking surveys, all of which feed into annual prioritization models reviewed each spring.
August 2026 data releases from several multi-league consortia revealed that venues scoring highest on combined utilization and revenue metrics received 60 percent of available capital improvement funds across the sampled networks. Those same reports indicated that sites demonstrating steady growth in junior program enrollment also climbed the priority list, even when raw revenue remained modest, because long-term participation forecasts influenced budget committees.
How Data Flows Through the System
Booking platforms export daily logs to centralized analytics tools that calculate rolling averages and flag outliers for review. League administrators then cross-reference these figures with external sources such as weather-adjusted attendance patterns and local school calendar overlaps. When a facility shows declining numbers over two consecutive quarters, coordinators often reduce its allocation of prime-time slots and redirect those hours to higher-performing venues within the same geographic cluster. This reallocation cycle repeats quarterly, allowing adjustments before annual capital plans lock in.
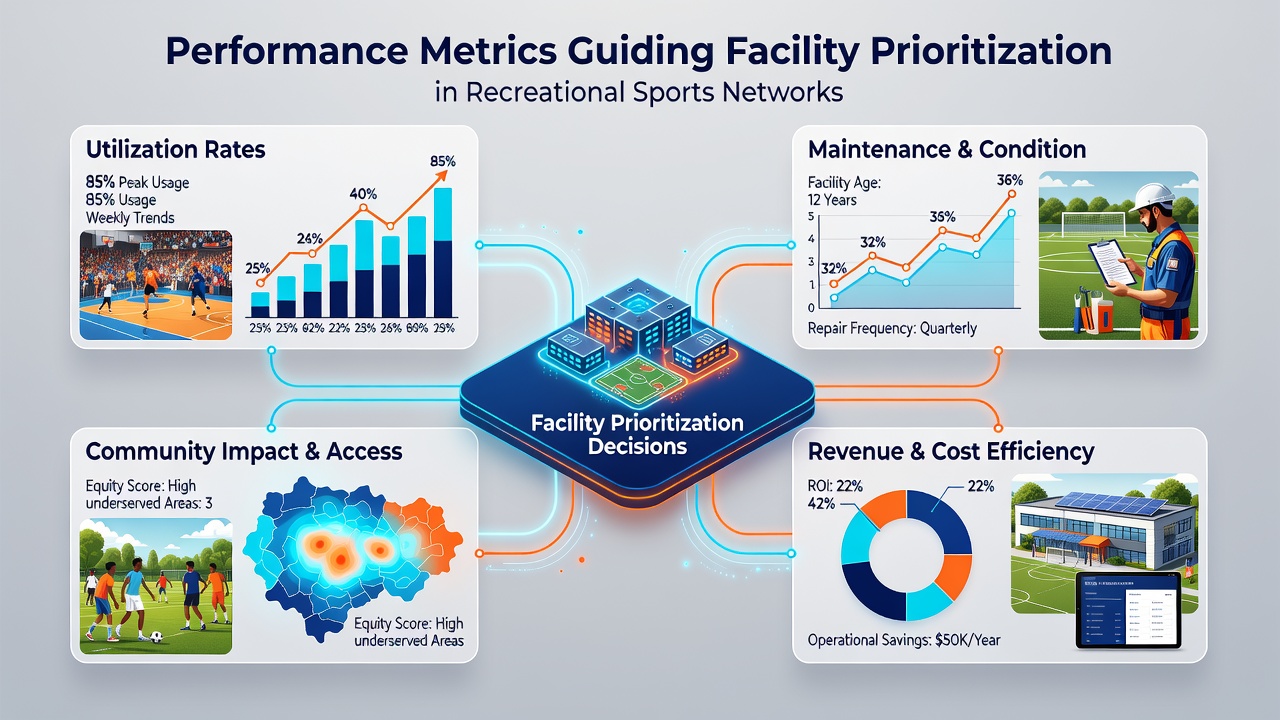
One network in the Pacific Northwest adjusted its indoor court rotation after metrics showed a 22 percent drop in weekday afternoon use at three suburban sites. Coordinators consolidated afternoon programs into two higher-traffic locations and used the freed capacity to host traveling tournaments that boosted overall revenue by 14 percent within six months, according to internal summaries shared with partner municipalities.
Regional Variations in Application
Canadian provincial bodies publish annual facility scorecards that combine participation density with energy efficiency readings, giving higher marks to sites that maintain strong throughput while lowering utility costs per user. Australian state sport agencies apply similar weighted formulas but place extra emphasis on regional equity metrics, ensuring rural facilities that meet minimum utilization thresholds still qualify for upgrades even when absolute numbers trail urban counterparts. European networks, particularly those coordinated through municipal sport offices in Germany and the Netherlands, integrate public transport accessibility scores into their models, elevating venues near major transit hubs when performance indicators remain comparable.
These differing weightings produce distinct outcomes. A facility in Calgary might advance for strong junior hockey enrollment figures, whereas a comparable site near Rotterdam could gain priority through combined foot-traffic and transit data even if enrollment growth lags slightly. Network operators exchange methodology notes at annual conferences, yet each region retains local adjustments tied to funding mandates and demographic targets.
Integration With Broader Planning
Performance dashboards now link directly to capital planning software used by public works departments, allowing facility managers to project maintenance cycles based on projected usage curves rather than fixed calendars. When models forecast sustained high demand at a particular complex, planners accelerate lighting upgrades or parking expansions to prevent bottlenecks. Conversely, sites showing plateaued or declining curves receive targeted programming interventions such as new league formats or partnership clinics before larger investments are considered.
Studies released by Sport Information Resource Centre in 2025 highlighted that networks employing these linked systems reduced average project approval time from 18 months to under 11 months, largely because metric-backed proposals encountered fewer objections during budget reviews. The same research noted that transparency around the scoring formulas encouraged venue operators to improve data quality, since incomplete logs could delay consideration for funding rounds.
Conclusion
Performance metrics now serve as the primary filter through which recreational sports networks evaluate and rank facilities for investment and scheduling priority. Utilization rates, revenue figures, participation trends, and supporting operational data combine to create objective ranking systems that shift resources toward sites demonstrating measurable demand and efficiency. Regional adaptations reflect local policy goals while maintaining the core practice of data-guided allocation, and ongoing integration with planning tools continues to shorten decision cycles across multiple networks.